Custom dashboards to track KPIs, performance, and sales trends.
Sales readiness and support
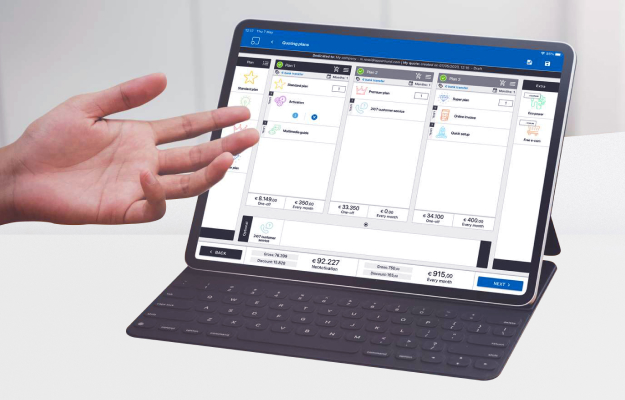
Configuration and quote management
Incentive and compensation management


Data-driven decisions
Custom dashboards to track KPIs, performance, and sales trends.
Accurate forecasts
Predict trends and outcomes based on historical performance data.

Improve where it counts
Identify weak spots and act fast with clear, actionable insights.